In 2017, record stock market performance overshadowed another area not normally associated with double-digit returns: long-duration investment grade corporate bonds.
Consider Conoco Phillips, with $21 billion of bonds that returned 11.4% last year. Then there’s Wal-Mart, whose $36 billion of outstanding bonds earned average returns of 9.9%. Or pharma company AbbVie with returns of 8.3% and Microsoft whose $60 billion of AAA-rated debt made investors an average 7.8%. [see chart below]

What distinguished these companies from the likes of Daimler, whose $39 billion of bonds earned a more humdrum return of 2.2%? The difference was duration, or the weighted maturity of bond cashflows. Increasing this from three years to seven years was enough to double returns in 2017, according to a Risky Finance analysis of hundreds of corporate bond issues tracked by iBoxx.

This would have been music to the ears of life insurance companies and pension funds, which are the biggest investors in these assets as a result of the need to match long-dated liabilities. Factors such as low US inflation and the European Central Bank’s corporate bond purchases may have been a factor in this outperformance.
But now, these (relatively) outsized returns may be in jeopardy. Only ten days into 2018, and US Treasury bonds are selling off, prompted by jitters about China’s slowing bond purchases and ECB tapering. Long-dated dollar-denominated corporate bonds have sold off too, with a year-to-date return of minus two per cent according to iBoxx index data.
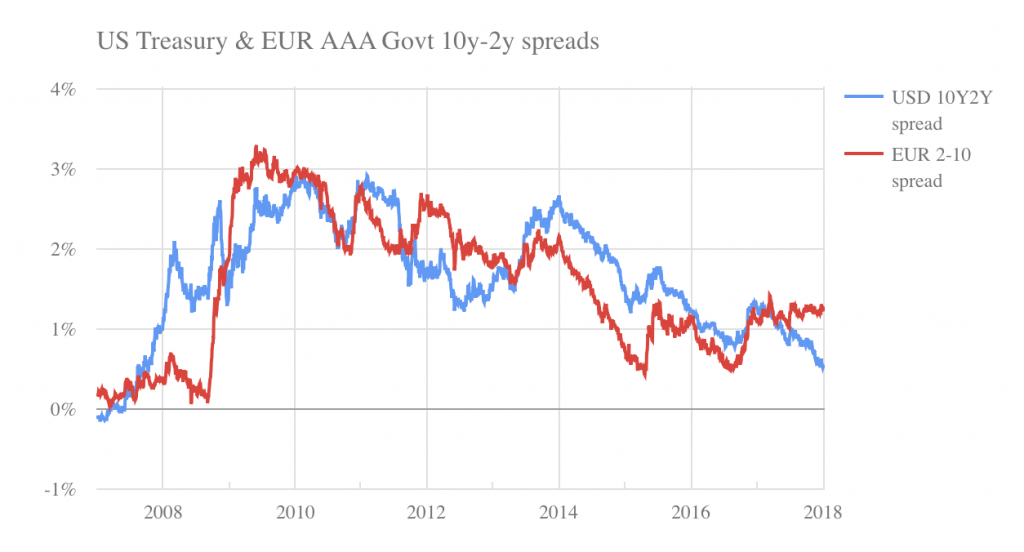
Is this the end of the boom in long-duration bonds? The US Treasury 10 year-2 year spread is currently at a ten year low, but could still go lower, with the dollar yield curve inverting as it did in early 2007. That was a time when the Fed was tightening as the subprime bubble burst, and in the financial crisis that followed, the 10-2 spread reached a peak of three per cent. Corporate bond spreads increased to an average 500 basis points in 2009.

The economic fundamentals don’t seem to point towards a 2007/8-type slowdown yet, but then again bursting asset bubbles have a way of leading the economic cycle because of their wealth-destroying effect. Combine that with a flight to liquid, short-dated cash-like assets, and the impact on bond investors and financial intermediaries could be profound.
 Levelling the Playing Field
 Barclays and Labour's growth plan
 Plummeting bonds reflect souring UK mood for outsourcing and privatisation
 Dimon rolls trading dice with excess capital