This century’s great experiment in central banking has met its biggest challenge: inflation.
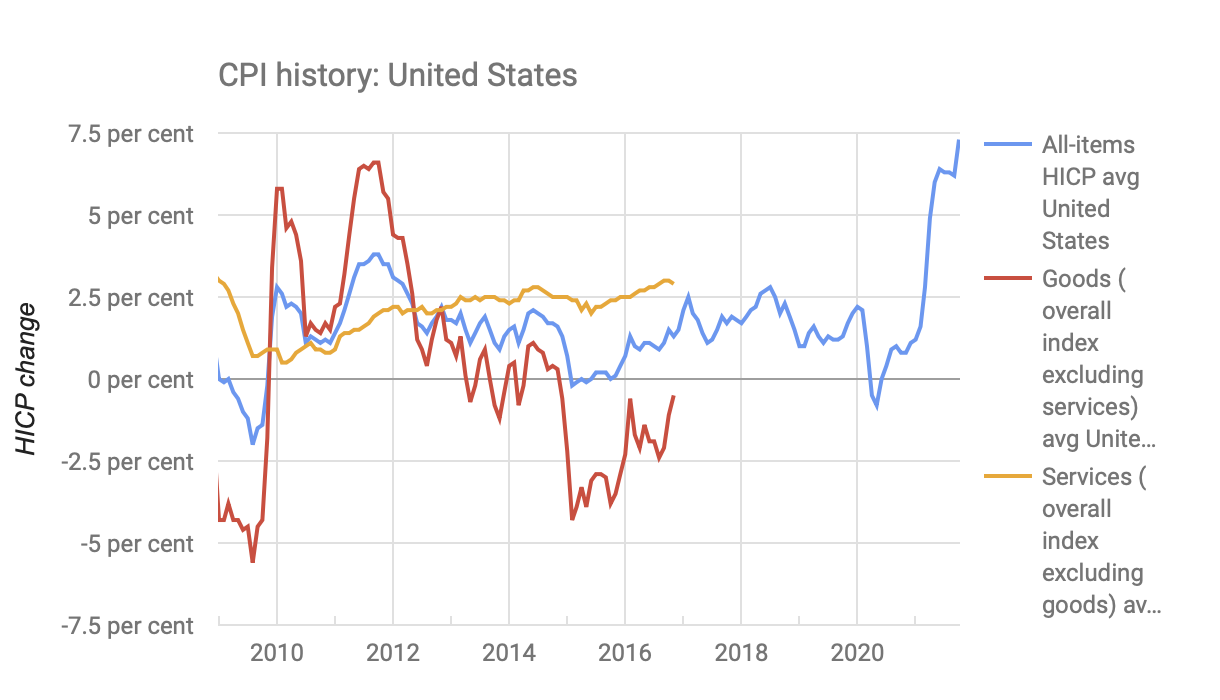
Years after being written off as a historical relic, inflation has come back, reaching levels not seen for four decades. As our inflation tool shows, US inflation rises above 7 % when you replace the headline urban CPI with an alternative (tracked by Eurostat) that includes rural consumer prices as well.
But markets have not reacted as they would have done in the past. Bond yields are still well below pre-pandemic levels, and stock markets are close to record highs.
The elephant in the room is the $16 trillion of (mostly sovereign) debt that central banks now own, and are continuing to buy at the rate of billions per month. It was bought to help prevent deflation, not least during the pandemic when about a third of the current total was acquired.
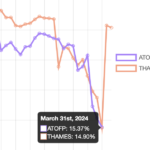
The interactive chart below, adapted from our sovereign visualisation tool, shows the scale of these quantitative easing purchases both before and after the pandemic.
 |
Click on the country headings to expand the view, and right click to return to the index overview. Data source: Markit iBoxx 
|
 Levelling the Playing Field
 Barclays and Labour's growth plan
 Plummeting bonds reflect souring UK mood for outsourcing and privatisation
 Dimon rolls trading dice with excess capital
