Warning signals multiplied in the first half of June – the US treasury curve inverted, the US-China trade war intensified, and the prospect of a very real war in the Persian Gulf pushed up oil prices. Central banks have reversed the tightening rhetoric of a few months ago, and markets are now anticipating a rate cut later this year.
That sparked a remarkable rally in stocks as investors bet that Fed chairman Jerome Powell will bail them out.

The picture of S&P 500 cumulative performance this year is almost identical to a year ago, with the difference that Microsoft has replaced Amazon as the ‘tentpole’ holding up the index. Once again, holding the four biggest market cap stocks at the start of the year outperform the index itself, with a 23% return vs 16% 1)note that our capitalisation weighting is different to the free-float weighting used by S&P.
The $420bn increase in Microsoft and Facebook’s market caps this year is equal to the entire market cap of the smallest 60 S&P 500 members (the world of Mattel, Harley-Davidson and Foot Locker). The gigantism arguments we have written about before seem truer than ever: the incumbent power of tech giants makes them unstoppable, their huge R&D budgets goose their shares with option value, and regulatory threats are perceived as impotent.
For companies that lack the same dominance or R&D optionality, the alternative is to buy it in, using cheap borrowed money. In the long term, the strategy is rife with execution risks, but in the short term, investors love it.
To see how, let’s filter our cumulative return chart for stocks that at the beginning of the year were in the midst of the process of acquiring others. These 76 M&A acquirers in the S&P 500, when ordered by cumulative cap-weighted return, converge on 21%, five percentage points more than the entire index.

Acquiring R&D expertise or market dominance seems to increase stock returns whether you are a media giant like Walt Disney, or a tech company like IBM or Fiserv. The only sector where investors are sceptical of M&A is healthcare, where companies such as Eli Lilly or Bristol Myers Squibb have lost ground this year.
If the market is so kind to the idea of M&A, then it makes sense to use leverage to do it. Indeed, two thirds of the $460bn of M&A deals in progress at the start of this year used cash, or a mixture of stock and cash.
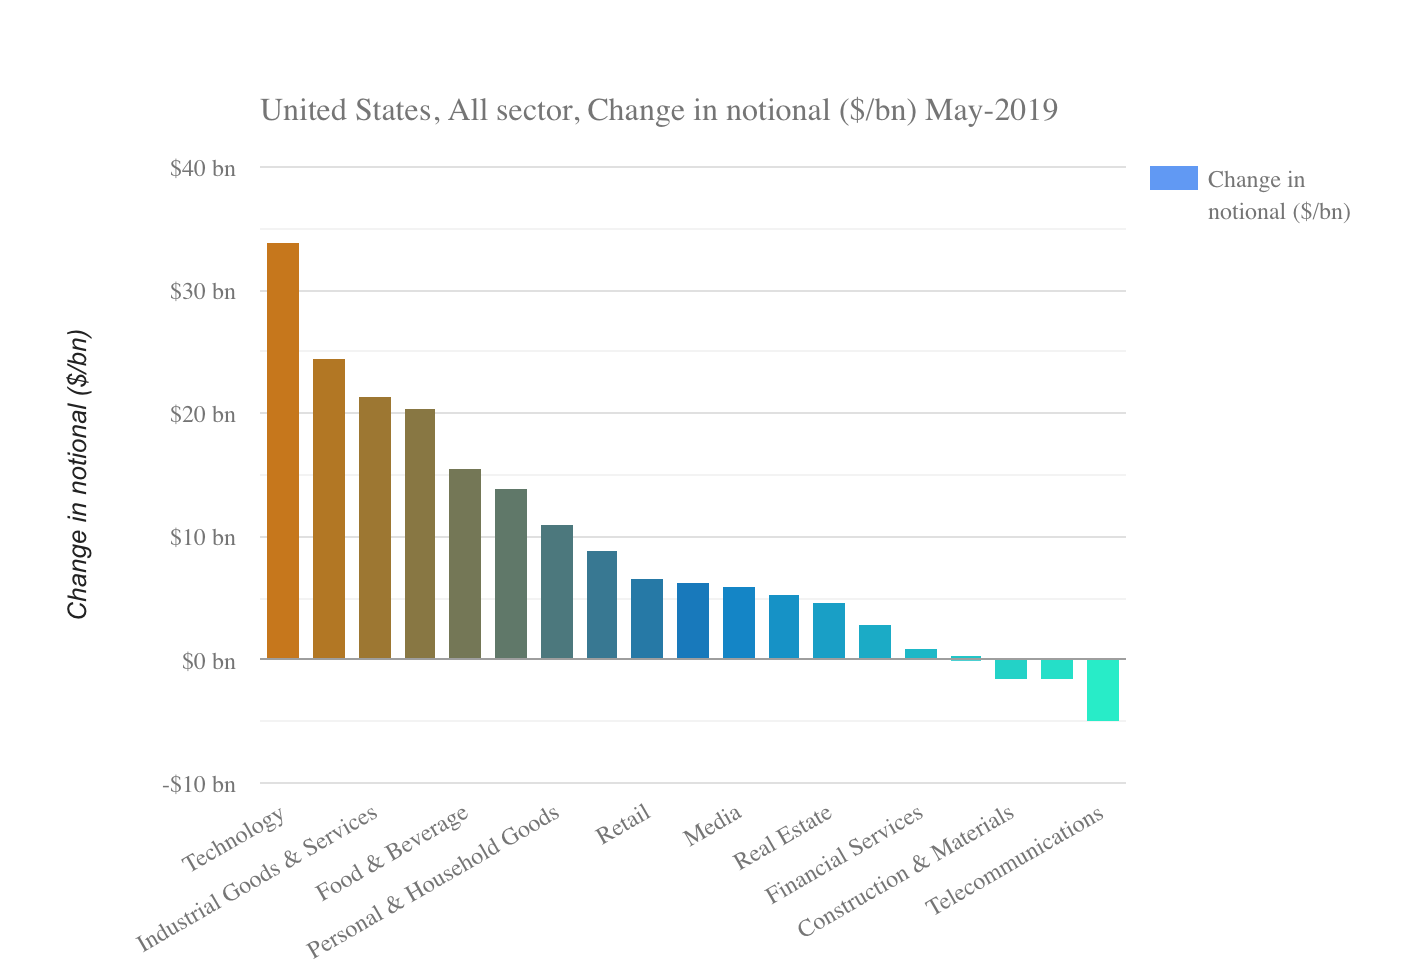
Paying for M&A deals is what drove US corporates to increase their total bonds outstanding by $170 billion in the first five months of 2019 according to iBoxx data. This increase was led by the technology sector which contributed $34 bn, followed by health care and industrial goods at $24 bn and $21 bn respectively.
Although things were less frenzied than in the equity market, by their own sober standard, credit investors were fine about the new borrowing. Credit spreads for US corporates declined across the board. It’s telling that spreads of companies that borrowed the most, such as IBM or Bristol Myers Squibb, declined more than companies that didn’t increase debt.
As with equities, perhaps the M&A deals that drove the borrowing seduced investors, offering them a more compelling growth narrative than the alternative of sitting on the sidelines doing nothing. And they can ignore all the worrying recessionary and geopolitical signals because they know that the Fed has their back.
References
| 1. | ↑ | note that our capitalisation weighting is different to the free-float weighting used by S&P |
 Levelling the Playing Field
 Barclays and Labour's growth plan
 Plummeting bonds reflect souring UK mood for outsourcing and privatisation
 Dimon rolls trading dice with excess capital
