When we decided to launch an FX visualisation tool, it wasn’t because the dollar was at a 30-40 year high against other major currencies. But it makes things more interesting.
There are two main approaches to looking at currency valuation – one economic, and one statistical. The economic approach combines exchange rates with fundamental data from each country. For example, including inflation leads you to the so-called real exchange rate, which research shows can often predict the actual exchange rate.
The statistical approach takes the historical data as a starting point. The example we have deployed in our new currency tool is the Z-score. Over a specific time period, such as a year, this is defined as the difference between the exchange rate and its average over the period, divided by standard deviation.
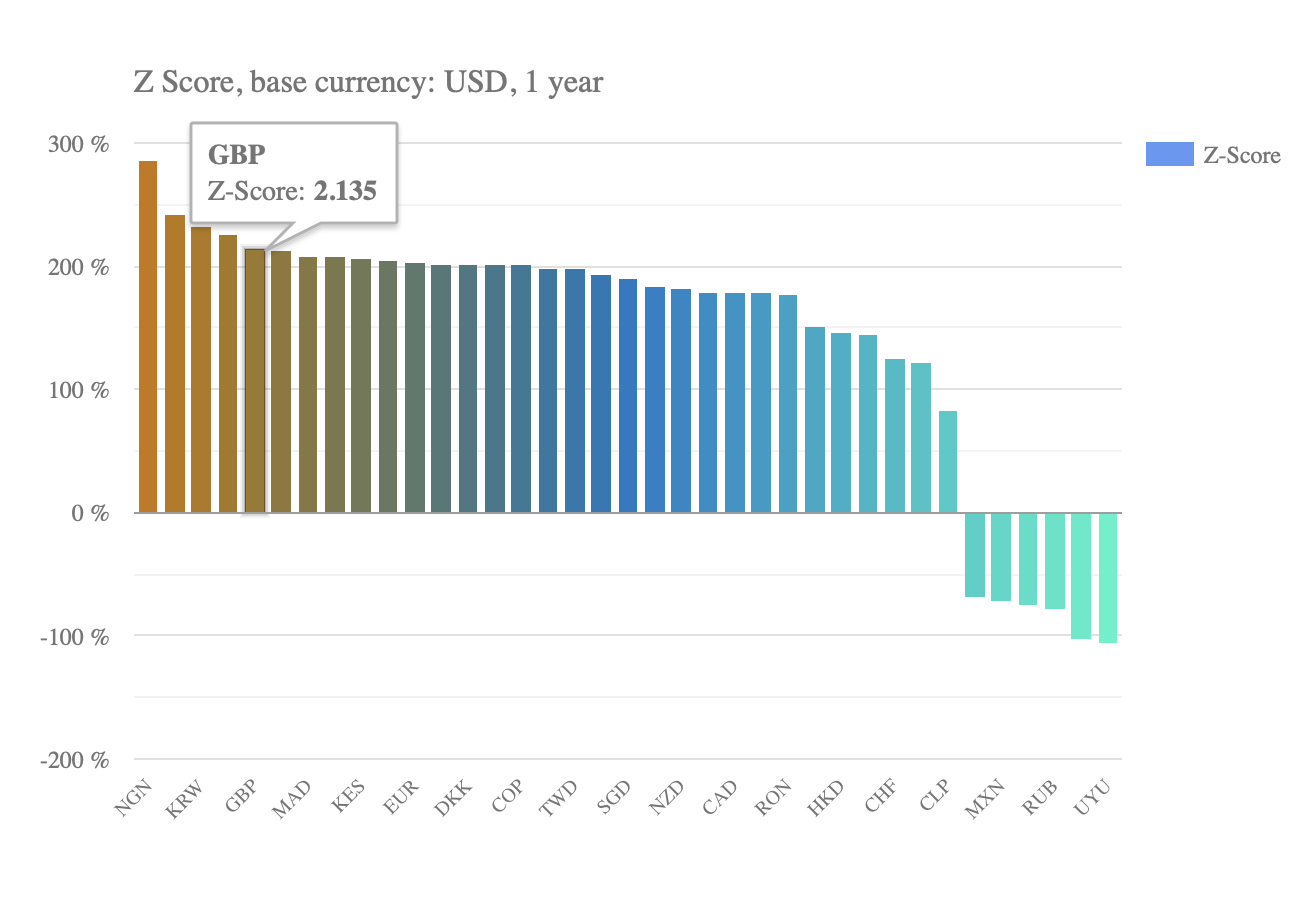
Going back to the example of UK sterling, its average price in dollars over this period was 1.3, compared with its current value of 1.17. Using the one-year standard deviation of 3.7%, that gives a Z-score of 2.13.
How should Z-scores be interpreted? If we assume that our one-year sample of daily FX data follows a normal distribution, then Z-scores of between minus and plus one are to be expected two thirds of the time. On the other hand, Z-scores of greater than ±2 should be observed on 5% of trading days (or 13 days in a year), while Z-scores of more than ±3 happen just on 0.2% of occasions, or one day per year at most.
Following this line of argument, high Z-scores might be thought of as a trading signal that a particular currency (such as sterling) is over or undervalued with respect to the dollar. The problem with it is the normal distribution assumption. Even though day-to-day moves in currencies (at least those that are freely floating and without emerging market jumpiness) may approximate a normal distribution, over time periods of a year or more, they tend to move in trends.
We can see this in the Risky Finance currency tool when we increase the time observation window. Over a one-year window, the Japanese yen has a Z-score of 1.8, implying a moderate weakness in the currency’s level compared with the average. Over a three-year window, the Z-score rises to almost 3, and over five years it approaches 4. The normal probability of this score is so vanishingly small that it shouldn’t be observed at all.
Clearly the normal distribution doesn’t describe the yen over a five-year period, which has seen a long-term weakening trend against the dollar. This may be connected to the fact that Japan is still pursuing quantitative easing in contrast to the US.
Only when viewed over a ten-year window does the yen’s Z-score start to fall again. Once we reach a 40-year window – which includes periods when the yen was even weaker than today – the yen’s Z-score is less than 0.5. In other words, it takes a very long timescale to iron out the effect of multi-year trends on FX rates. A similar long-term trend describes euro and sterling, both weakening as a result of EU and UK exposure to high energy costs and the need for government bailouts.
While it stays in beta, we’ll be tweaking and enhancing the currency tool. In the meantime, please send us an email if you have questions or feedback.
 Levelling the Playing Field
 Barclays and Labour's growth plan
 Plummeting bonds reflect souring UK mood for outsourcing and privatisation
 Dimon rolls trading dice with excess capital
