It’s taken a few years since we started covering it, but the slow-motion decline of Chinese real estate debt can now be awarded meltdown status. With the debt of bankrupt issuers trading at three per cent of face value, and last year’s government rescue plan having fizzled out, the losses invite comparison with the 2008 US subprime crisis.
We start with the Risky Finance corporate bond tool, selecting for China’s real estate sector. This aggregates hundreds of S&P Dow Jones iBoxx-listed dollar bonds that had a total face value of $160 billion two years ago. Today, bonds with the same characteristics have a total value of just $20 billion, according to iBoxx USD Asia ex-Japan data.
This does not necessarily mean that those bonds worth $160 billion in June 2021 have lost 87 per cent of their value, or $140 billion. A large chunk of Chinese real estate debt from two years ago is now invisible because iBoxx removes bonds from its index that have defaulted.
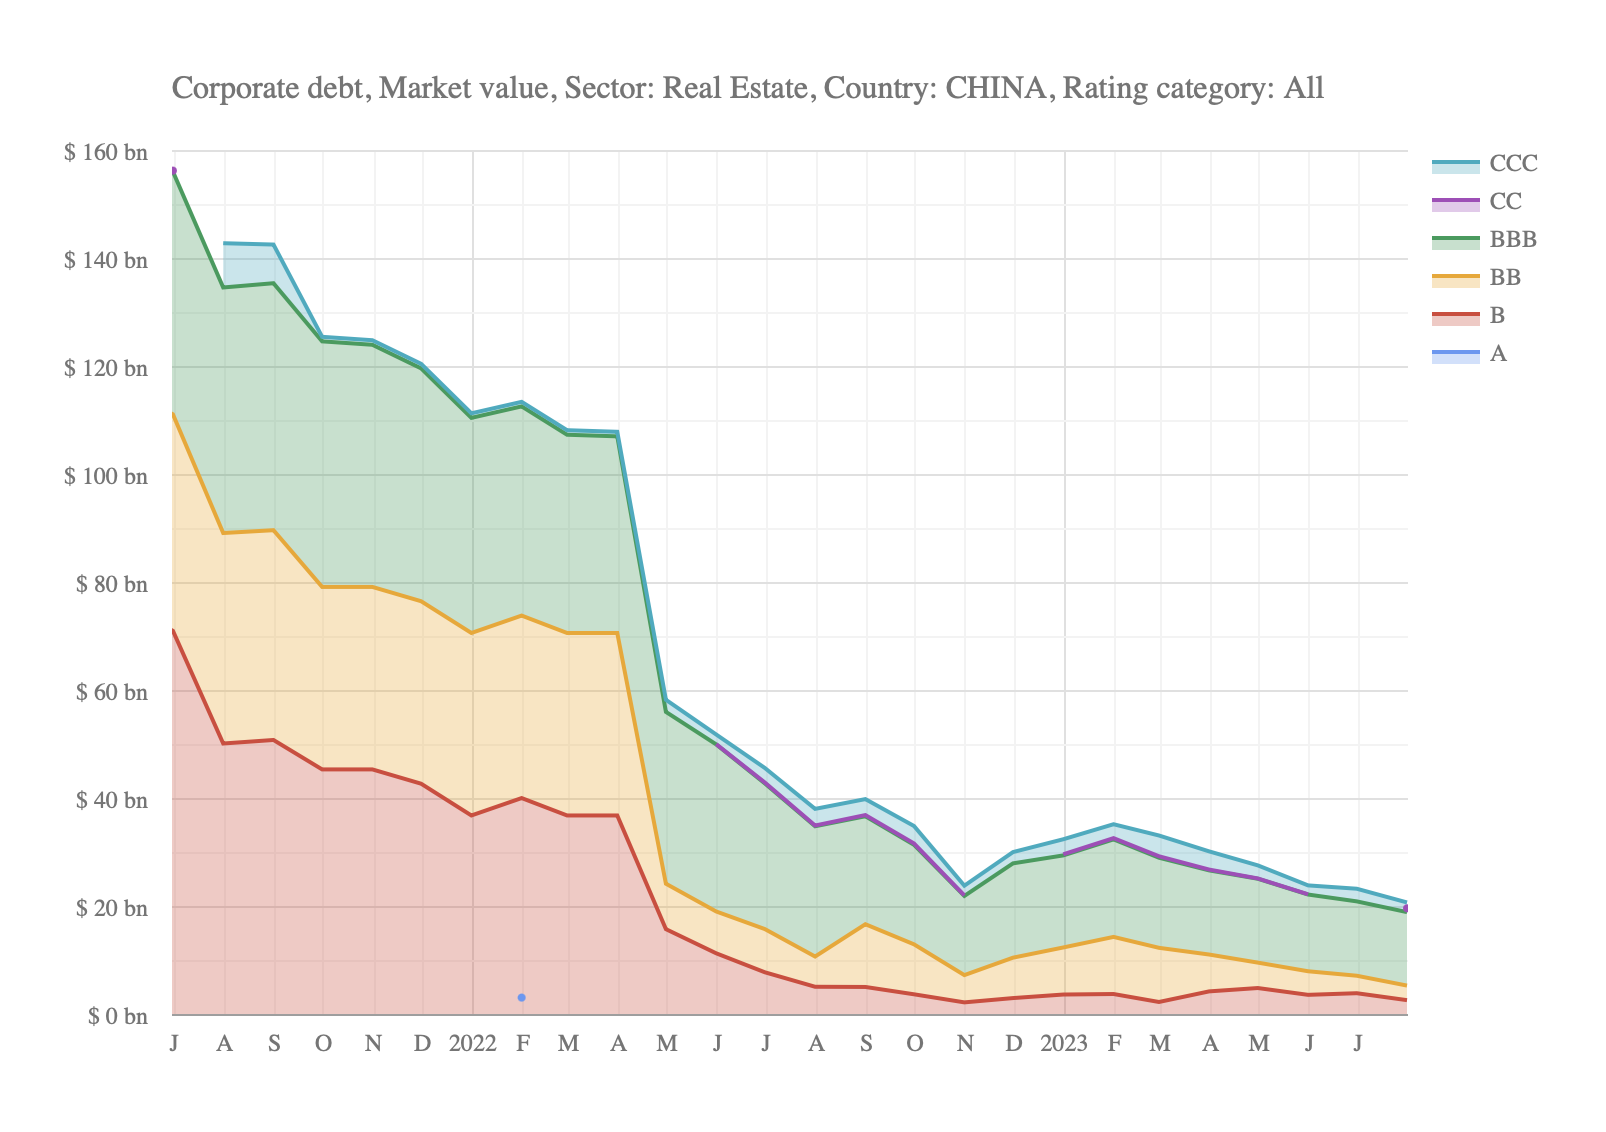 |
This chart shows the aggregate market value of Chinese dollar-denominated real estate debt from June 2021. For each month’s data, values are grouped by credit rating. Bonds that default are removed from the index.
|
![]()
Our second chart includes those defaulted issuers, using the conservative assumption that their bonds maintained their value after the date that iBoxx removed them. Using this assumption, the $160 billion of bonds from 2021 lost $75 billion of market value as of July 2023.
 Levelling the Playing Field
 Barclays and Labour's growth plan
 Plummeting bonds reflect souring UK mood for outsourcing and privatisation
 Dimon rolls trading dice with excess capital
